

GATE Packages
GATE Ultimate PLUS
GATE Fundamentals
GATE Functions
NEWSLETTER
Join our mailing list and stay in touch with the latest GATE news and research
![]()

Download Brochure
GATE "Ultimate PLUS"
A comprehensive toolkit for serious traders that require in-depth market analysis at their fingertips. GATE Ultimate PLUS includes:
- A set of 24 Videos showing you how to use each function of GATE
- Includes a comprehensive set of User Guides
- All of the functions shown below
GATE Ultimate PLUS is priced for a speedy return on your investment with limited risk.
|
NOW - For a Limited time ONLY
*Then pay A$375** in month 2 and A$375** in month 3 OR SAVE $50 and Pay ONLY A$997** |
** All prices are inclusive of taxes and bank charges. An annual license fee of A$179 is payable from the second year onwards for the continuing use of GATE, support and upgrades. GATE may not be copied or passed on to a third party. All prices are subject to review from time to time. All prices are quoted in A$ (Australian) Dollars. All prices are exclusive of any market data, environmental or any other software. GATE requires Microsoft Excel 97/2003, 2007 or 2010.GATE will run on Windows XP, Widows Vista, Windows 07 or the Windows partition in an Apple MAC.
GATE Ultimate PLUS Includes
GATE Foundations - Videos (DVD) | ||
|
|
GATE Foundation Videos |
A DVD containing the Video Series covering each GATE function in detail. These Videos will allow you to get started with GATE quickly and allow you to concentrate on your Trading Analysis Videos are conveniently split into individual functional allowing you to focus on the particular function you are currently working with |
GATE - Data and Charting | ||
|
|
Swing Charts & Bar Charts in Flash |
Swing tops and bottoms calculated for Daily, Weekly, Monthly, Quarterly and Annual Swings. Draw swing charts and bar charts for a market using your selected timeframe. More ... |
GATE - Know Your Market | ||
|
|
Segments of the Market |
Study past patterns in the market -and identify a road map for the current market. Extract multiple segments of the market in minutes - Study how the market trades into or out of Public holidays, Interest Rate movements, Elections, Swing Tops, Swing Bottoms. Print out the charts that GATE produces and use them as a road map for current market action. More ... |
|
|
Master Time Cycles - Statistics |
A series of graphs which - based on past performance - will quickly identify the most common months for High or Lows, Days of Months for swings, common ranges, and time cycles. More ... |
|
|
Cycle Finder |
Find repeating time cycles in an instant. Function includes options to include 50% and 200% of cycles, as well as a easy reference chart showing time cycles for short term and long term cycles. More ... |
 |
Market Heartbeat |
You select the accuracy Rate 65-85% or more ((tolerance) in identifying the next swing date (with a minimal tolerance can be achieved.
Find and Test the Heartbeat of a Market - Identifying the next swing (turning point) in a Market. With a few simple selections - choose the Start Date you want to use (by default Gate will use the Birth Date of the Market). Test the number of occurrences the range of cycles you supply actually identify a Swing - and provide statistics which will enable you to decide which cycle and start date to use. |
GATE - Time Clusters, Calendars, Cycle Predictors | ||
|
Day Count Calendar - Time Clusters |
GATE will maintain a day count for important swing tops and bottoms and highlight important cycles and repeating cycles. These are maintained in a Calendar format making it extremely easy to identify time clusters. More ... |
|
Time Clusters - Monthly Calendar |
Combine repeating Time Cycles with your selected ABC setup and the time cycles out from important highs and lows into a single Calendar with the whole month displayed on a single page. More ... |
 |
Annual Calendar - Seasonal Dates |
Don't miss the important cycles from the birth of the contract as well as the GANN Seasonal dates. These dates are shown on a single sheet for the year and automatically included into the Day COunt Calendar and the Monthly Calendar. More ... |
 |
History Time Cycles and Price Ranges |
Find all occurrences of any Time Cycle (Trading Days or Calendar Days) or Price Range. Use filters to show the most frequently repeating cycles. Lookup any time cycle between any Swing Top and Bottom. More ... |
 |
Time and Price Cycle Predictor |
Using the time cycles you have selected for a Market, GATE will graphically show Predicted Swigs and include all Swings that have already been made. This allows for easy back testing and forward predictions. More ... |
 |
Degree Reference (Wall) Charts |
GATE will build 30 degree, 45 degree, 60 degree and 90 degree reference tables with past swings highlighted. Find repeating cycles using these degree tables is a simple matter of lining up the highlighted past swings. More ... |
 |
GANN Emblem dates for history swing Tops and Bottoms |
GATE calculates all the common degree interval Dates out from Swing Tops and Bottoms. With the filters provided it becomes very easy to see repeating Cycles when they occur. More ... |
GATE - Price - Price Clusters, Fluctuation Cards, Calculators | ||
 |
Price Support and Resistance Clusters |
GATE will cluster prices calculated for Resistance levels or Support levels. Using a simple click and select method GATE will calculate the retracements levels from a Low to the preceding highs leading into the low and include any selected price projections out from ABC setups. More ... |
 |
Price Fluctuation (Resistance) Cards |
GATE will create the Fluctuation cards as set out by WD GANN. Gate goes one step further -Gate Clusters all the calculated prices and identifies Clusters so that references to all previous market actions can be easily seen |
 |
"What If" Analysis - Risk Reward Calculator |
Calculate Time and Price Projections. Calculate the Risk Reward ratio of taking a Trade before you trade and know the risk. Plan your trade - What If the market Opens at a certain Price. |
 |
GANN Angle Calculator - Includes past swings that touch |
Calculate the GANN Angles from any Price -- Select the Price from a list of Swing Tops of Bottoms or key in the date and Price. GATE calculate the Price of all angles at a Future date and also show all the Swing Tops and bottoms that have turned on touching any of the lines |
 |
Trend Line Calculator - Includes past swings that touch |
Calculate the Prices along a Trend Line. Select the Price from a list of Swing Tops of Bottoms or key in the Prices creating up the Trend line. GATE calculate the Price for the trend line at a Future date and also show all the Swing TOps and bottoms that have turned on touching the trend lines |
GATE - Squares, Square 9, Square of 4, Square Price (Hi, Low,Range) | ||
 |
Square based on Price or Time Squares - with past Swings highlighted |
Gate will create any Square and highlight previous Swing Tops and Bottoms inside the square. The squares can be created using either Price or a Date. |
 |
Square of 9 - with past Swings highlighted |
Gate will construct a Square of 9 and highlight previous Swing Tops and Bottoms inside the square. The squares can be created using either Price or a Date. The square of Nine is created with static lines as well as a pair of rotating lines through the use of a single key stroke (Ctrl+L to rotate Left, Ctrl+R to rotate Right) making it easy to line up price and time |
 |
Square of 4 (advanced) - with past Swings highlighted |
The Square of 4 has the same features as the Square of 9. The Square of 4 has the additional option where Price and TIme are shown in the same squares. |
 |
Square Price (Hi, Low, Range with past Swings analysis |
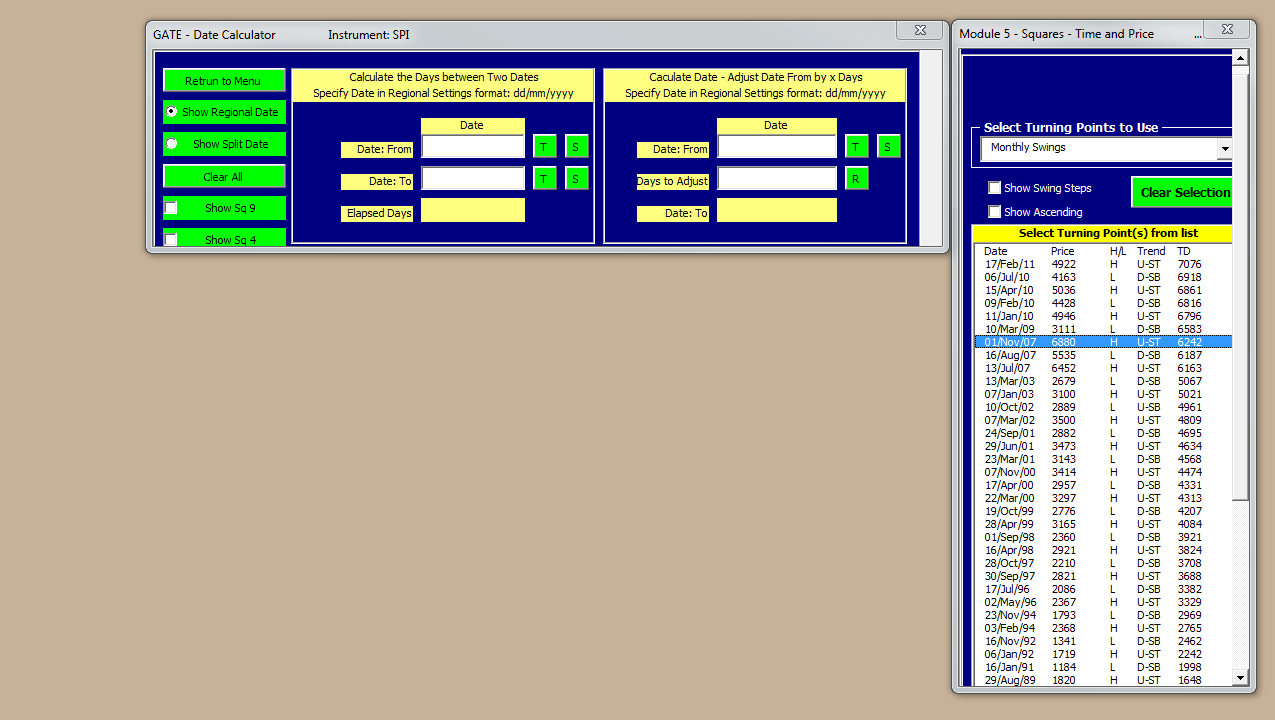
Use Gate to perform all the calculation for Square a High, a Low, or a Range. Gate will use Price as Time, as well as using Calendar days as Trading days. All dates are checked against previous Swings and reported - making it easy to evaluate the past when using future dates. |
 |
Zero Date Calculator |
Once you have established your "Future"date (zero date) - use Gate to verify that date by checking against previous Swings in the market as well calculating the time from previous Swings to your calculated Zero Date. |
|
GANN Emblem Date Calculator |
Gate will calculate the Gann Emblem degree dates for a given Date.You can select this date from a Gate supplied drop down .list or key in your own date. |
GATE - Old Date Calculators | ||
 |
Date (Prior 1900) Calculator for ALL Dates |
NEW GATE Function - Date Calculator - Use ANY Dates going back to the year 0001 Video
|

Package Highlights
Get to know your time and price ranges
Easily find repeating time cycles, extract exactly when these cycles occurred and then use GATE to find date clusters and keep track of when these clusters or cycles next occur through the use of calendars to provide graphical view of this information.
- Create day, month or seasonal date calendars
- Include and track current and major ABC setups in your calendar
Swing Charts & Bar Charts in a Flash
You will be impressed with how quick and easy it is to use GATE to draw swing charts and bar charts for a market using your selected timeframe.
Identify cycles quickly and easily
Simple to use calculators easily identify key dates and cycles.
- Predict potential future turning points and analyze time ranges with the cycle predictor.
- Calculate Gann emblem dates for all significant swings and your target date.
- Use the GATE Zero Date calculator to confirm your target date by checking against swings already made in the market and calculate the time cycles ranges between your Zero Date and past swings.
Priceless Information Delivered via “What if?” Analysis
When you are not sure of its potential and need to understand the associated risk and reward for a trade - use the GATE Risk Reward calculator to calculate the risk before you enter a trade at the available entry price. GATE will effortlessly calculate your reward based on a price projection using two prior swings (top/bottom or bottom/top). GATE includes Time projection based on these same two points which will support your when to trade decision.
Know Your Prices
GATE creates a number of Range Fluctuations (Resistance cards) based on previous (history) and current swings made in the market. Find price resistance clusters or price support clusters based on price retracing together with price projections.
- Reports available to highlight price clusters as well as all other calculated prices.
- Calculate a future price for selected Gann Angles.
- Calculate a future price for an established trend line.
- Know the Resistance and Support Prices.
Create and understand Squares.
GATE provides options to create virtually any square based on price or a date and each square is created separately with past swings highlighted within each square.
- Display time cycles for Swings that are an exact Square..
- Check and highlight when subsequent swings occur and report on future dates when the cycle next repeats.
- Calculate cycles using the birth of the contract or a specific date
- Create a square of 9 based on a price or date using any starting point that you select.
- Create a traditional Square of 4 based on price or date or a variation combining time and price using any starting point that you select.
- Gann Emblem date calculator.
Other Key features
- Use the GATE Zero Date calculator to confirm your target date by checking against swings already made in the market
- Calculate the time cycles ranges between your Zero Date and past swings.
- Square a High or Low and use the price as time to predict potential turns in the market.
- GATE will squared time and prices calculations against previous swings made by the market.
- Square a Range (both time and price) and use this range to calculate future turns.
- GATE calculates and maintains a number of statistics that show you the markets past performance and assists in identifying time periods for swing highs and lows.
- GATE will extract and chart segments of the market to assist you in identifying past market patterns and actions that may repeat in the future.
Examples with Benefits
Module 1 - Swing and Bar Charts
Follow the trend using the time frame you are trading in. Choose from Daily, Weekly, Monthly, Quarterly and Annual time frames
Module 2 - Segments of the Market and Statistics
Module 3 - Time Cycles - Calendars, Time Clusters, Predictor
Using GATE's predictor functionality to calculate potential future swings (See the Chart below for the actual Swings made in this Market (Swiss Franc)
Module 4 - Price Clusters, Fluctuation Cards, Risk Reward Calculators
Module 5 - Squares, Square Hi/Low/Range
![]()
|
||